
Snipe Worlds Mahón 2026 – Boats and Sails Statistics
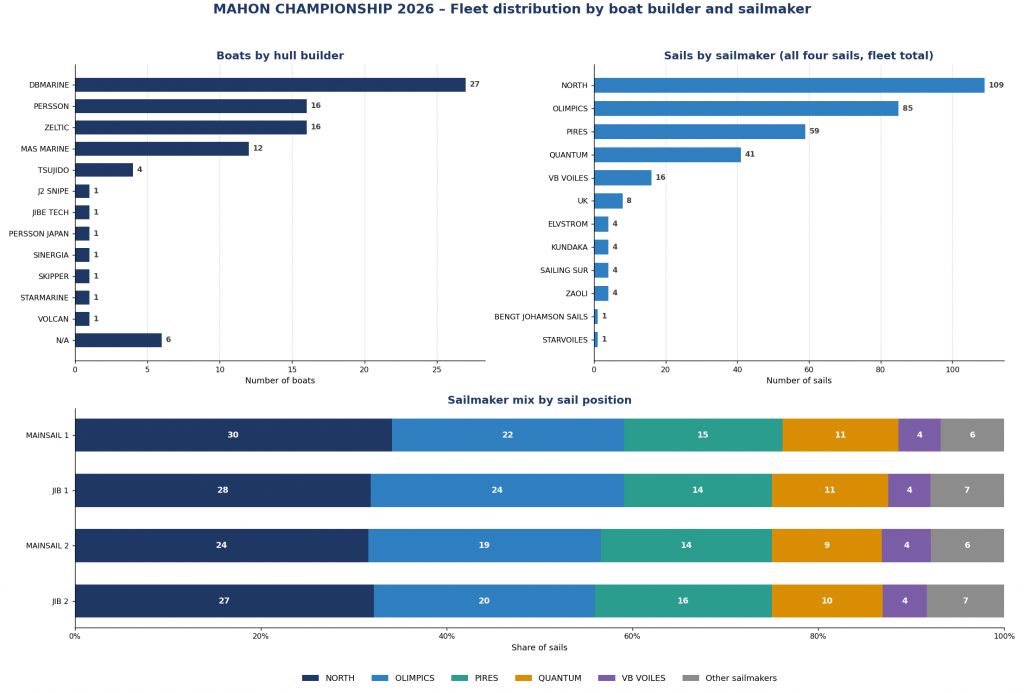
Here is the full list and graphic representation of the hulls and sails used at the recent Snipe World Championship in Mahón.
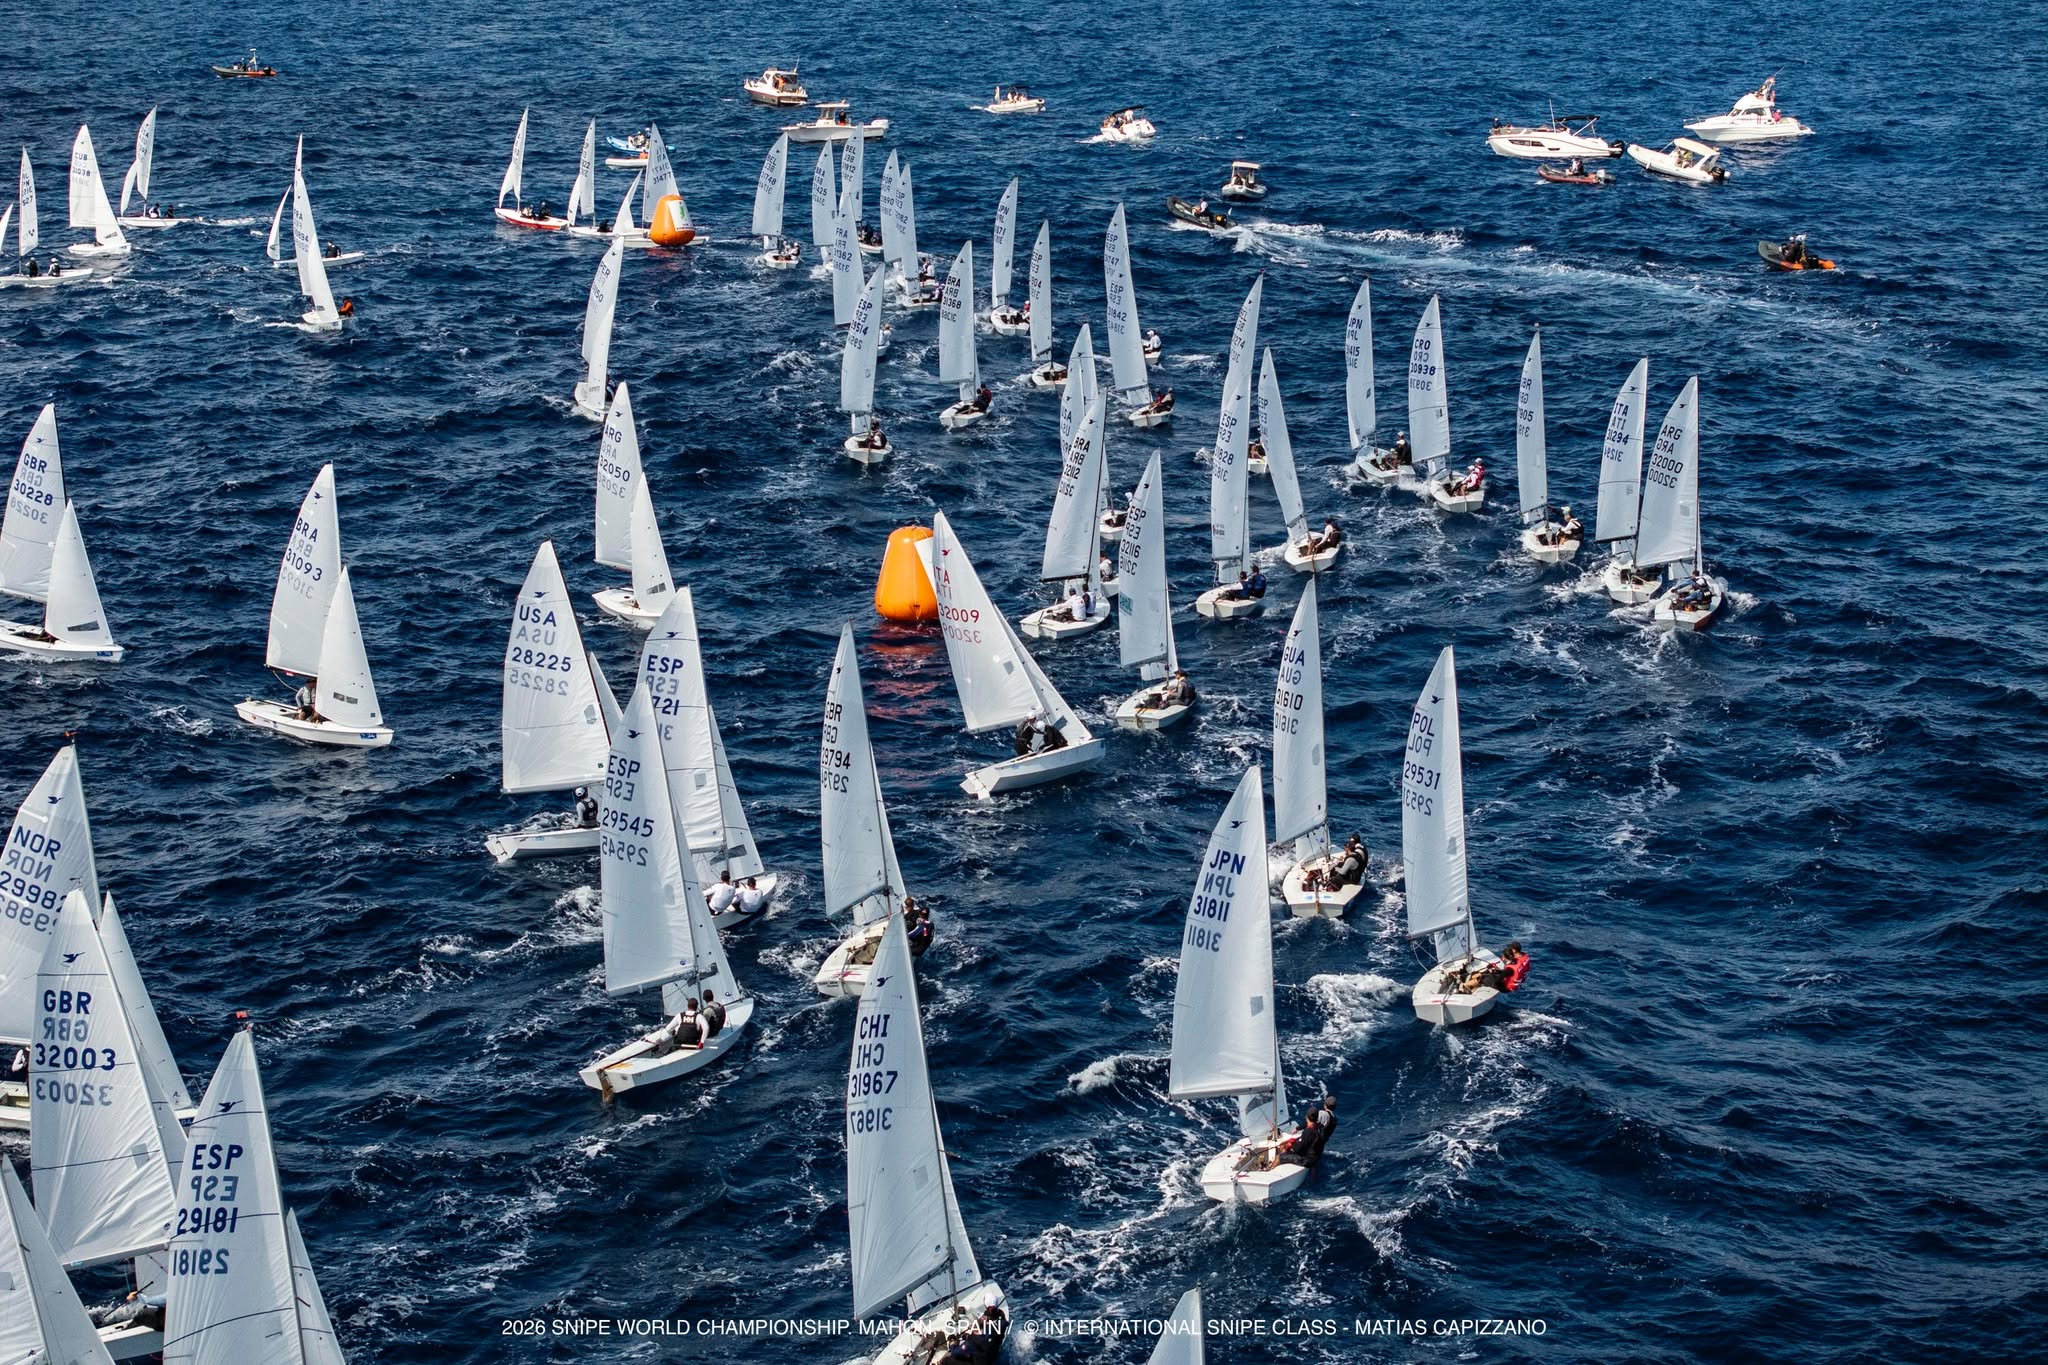
Here is the full list and graphic representation of the hulls and sails used at the recent Snipe World Championship in Mahón. The data covers all 88 boats on the start line: hull builder, year of construction and the sail inventory of each crew (mainsails and jibs).
Beyond the numbers, you will also find the analysis by Antonio Bari (Technical Committee Chair) and Luis M. Gonzalez Alvarez (Chief Measurer), who looked at how much equipment really mattered in the final standings.
By Antonio Bari
Summary of the 2026 Snipe World Championship: Performance Analysis and Impact Factors
The official report drafted by Snipe class chief measurer Luis M. Gonzalez Alvarez analyses the measurement and equipment data of 88 boats that competed in the 2026 World Championship in Mahón, with the goal of understanding how much technical boat characteristics truly impact final results. Being a strictly one-design sailing class (where boats are designed to be as identical as possible), structural differences are minimal.
First of all, a brief explanation of the symbols (𝜌 and p) and the terms used in the report and in this summary.
- 𝜌(Spearman’s 𝜌): This is the rank correlation coefficient. It measures the strength and direction of the relationship between two variables (for example, between the boat’s age and its final ranking). Its values range from -1 to +1:
– A positive value indicates that as one variable increases, the other tends to increase as well (for example, as the age of the boat increases, the finishing position number increases, meaning a worse ranking).
– A value close to 0 indicates that there is no linear relationship between the two variables.
- p (p-value or significance level): This indicates the probability that the observed correlation or phenomenon is due to chance.
– In statistics, a very low p-value is sought (typically less than 0.05 or 0.01).
– If the p-value is below this threshold (as in the case of boat age with p = 0.009), the result is considered statistically significant, giving us confidence that the relationship found is real and not just a coincidence.
- Median indicates the values in the middle of the distribution (not to be confused with the Mean).
Characteristics that Had the Greatest Impact on Results
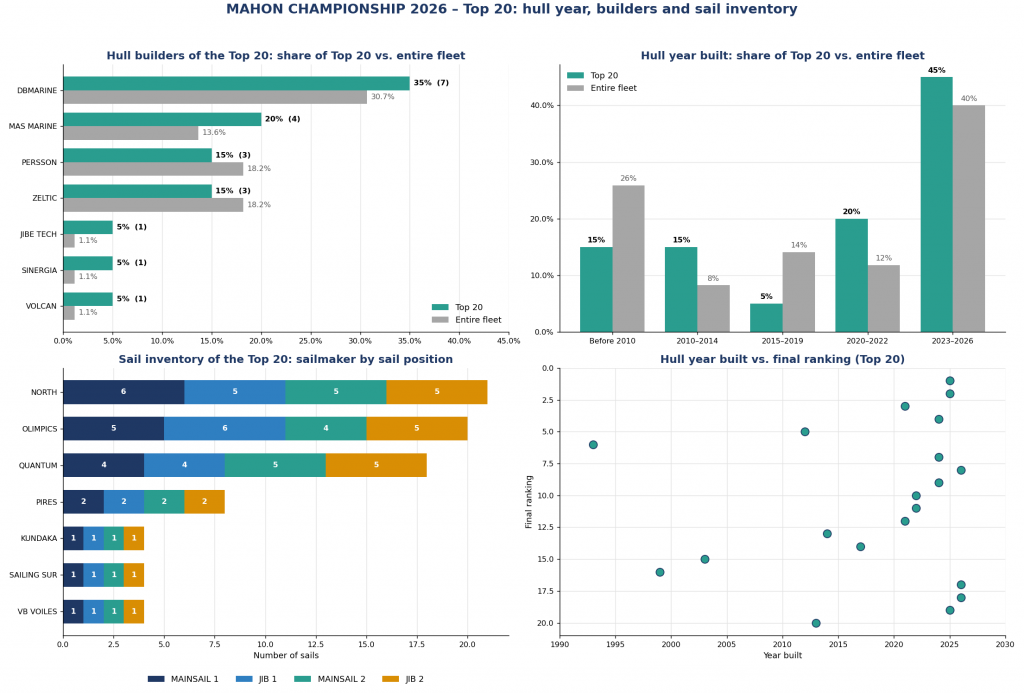
Statistical analysis shows that technical variables overall account for only a modest share of the final standings (about 18.5% of the variance). The only technical factor showing a robust and statistically significant correlation with placement is boat age (𝜌= +0.28, p = 0.009). On average, newer boats tend to rank better: the construction period shows a steady improvement, moving from a median of 62 for boats built before 2015 to a median of 35 for those built from 2022 onward. In the multivariate model, each additional year of boat age results in an average loss of about 0.8 positions in the standings.
However, age is not an absolute dogma: older hulls sailed by experienced crews still achieved exceptional results (for example, a 1993 Persson hull placed 6th and a 2012 one placed 5th).
The factor with by far the greatest overall influence, however, is not related to the boat, but rather to nationality and the host fleet: being part of the Spanish fleet doubled the explanatory power of the model. Spanish boats finished with a median of 20 compared to 53 for foreign boats, highlighting how local course knowledge, experience, and preparation clearly dominate over material factors.
Characteristics with Minimal or Negligible Impact
The vast majority of traditional technical variables show no significant correlation with the standings once the homogeneity of the fleet is taken into account:
- Hull weight and moment of inertia: The fleet is rigidly concentrated around the class minimums (with an average weight of 174.48 kg and a standard deviation of just 1.64 kg). Values such as the moment of inertia (with a correlation of 𝜌 = +0.07, p = 0.54) or hull weight do not discriminate between good and poor results, except for a very few isolated outliers (such as a 184 kg hull finishing in the back).
- Correctors weights and position: Although the top ten finishers showed a slight tendency to use a slightly lower amount of correctors weights (a median of 5.5 kg versus 8.0 kg for the lower tier), the overall correlation is not statistically significant (𝜌= +0.12, p = 0.27).
- Daggerboard and rudder: Daggerboard values and rudder weight (median of 3.07 kg) fall within such a narrow range that they show no noticeable difference in competition outcomes (𝜌 = +0.10 for the centerboard and 𝜌= +0.12 for the rudder).
- Boatbuilder and sailmaker: There are no statistically significant differences related to the choice of boatbuilder (Kruskal-Wallis test p = 0.60) or sailmaker (p = 0.48). Although Mas Marine boats claimed first and second place and DB Marine placed the most boats in the top 20 (note: in the statistic the two boatyards are listed as different, but the boat is the same), both brands also have many boats in the second half of the standings. However, a slight tendency is noted among the top ten finishers to use a consistent sail inventory from the same brand (90% compared to 61% for the bottom positions).
Conclusions
In summary, within a class strictly controlled by measurement rules, owning a modern and well-prepared boat guarantees a measurable yet time-limited advantage. Beyond the structural minimums guaranteed by measurement, the final result at Mahón 2026 was primarily decided by the technical skills, tactics, and deep local knowledge of the crews.
Leave a reply
Your email address will not be published. Your comment will be revised by the site if needed.

0 comments